What Twinise is for
A live 3D model of a real place, fed by real sensors, so the question “how is it actually doing?” has an answer you can see. Start with the situation closest to yours.
A whole city, live in one model
We built a live 3D twin of Newcastle upon Tyne in Unreal Engine on open data from the Newcastle Urban Observatory. It brings 760 sensors, through eight groups of feeds, into one Twinise site: journey-time and footfall counters, air-quality monitors, river and rain gauges and thermometers.
- Live values pinned where each sensor stands in the city.
- Air-quality readings drawn as a layer across the city, interpolated between monitors.
- A river-level alert on the Tyne that fires when a threshold you set is crossed.
- The last 24 hours replayed in a minute.
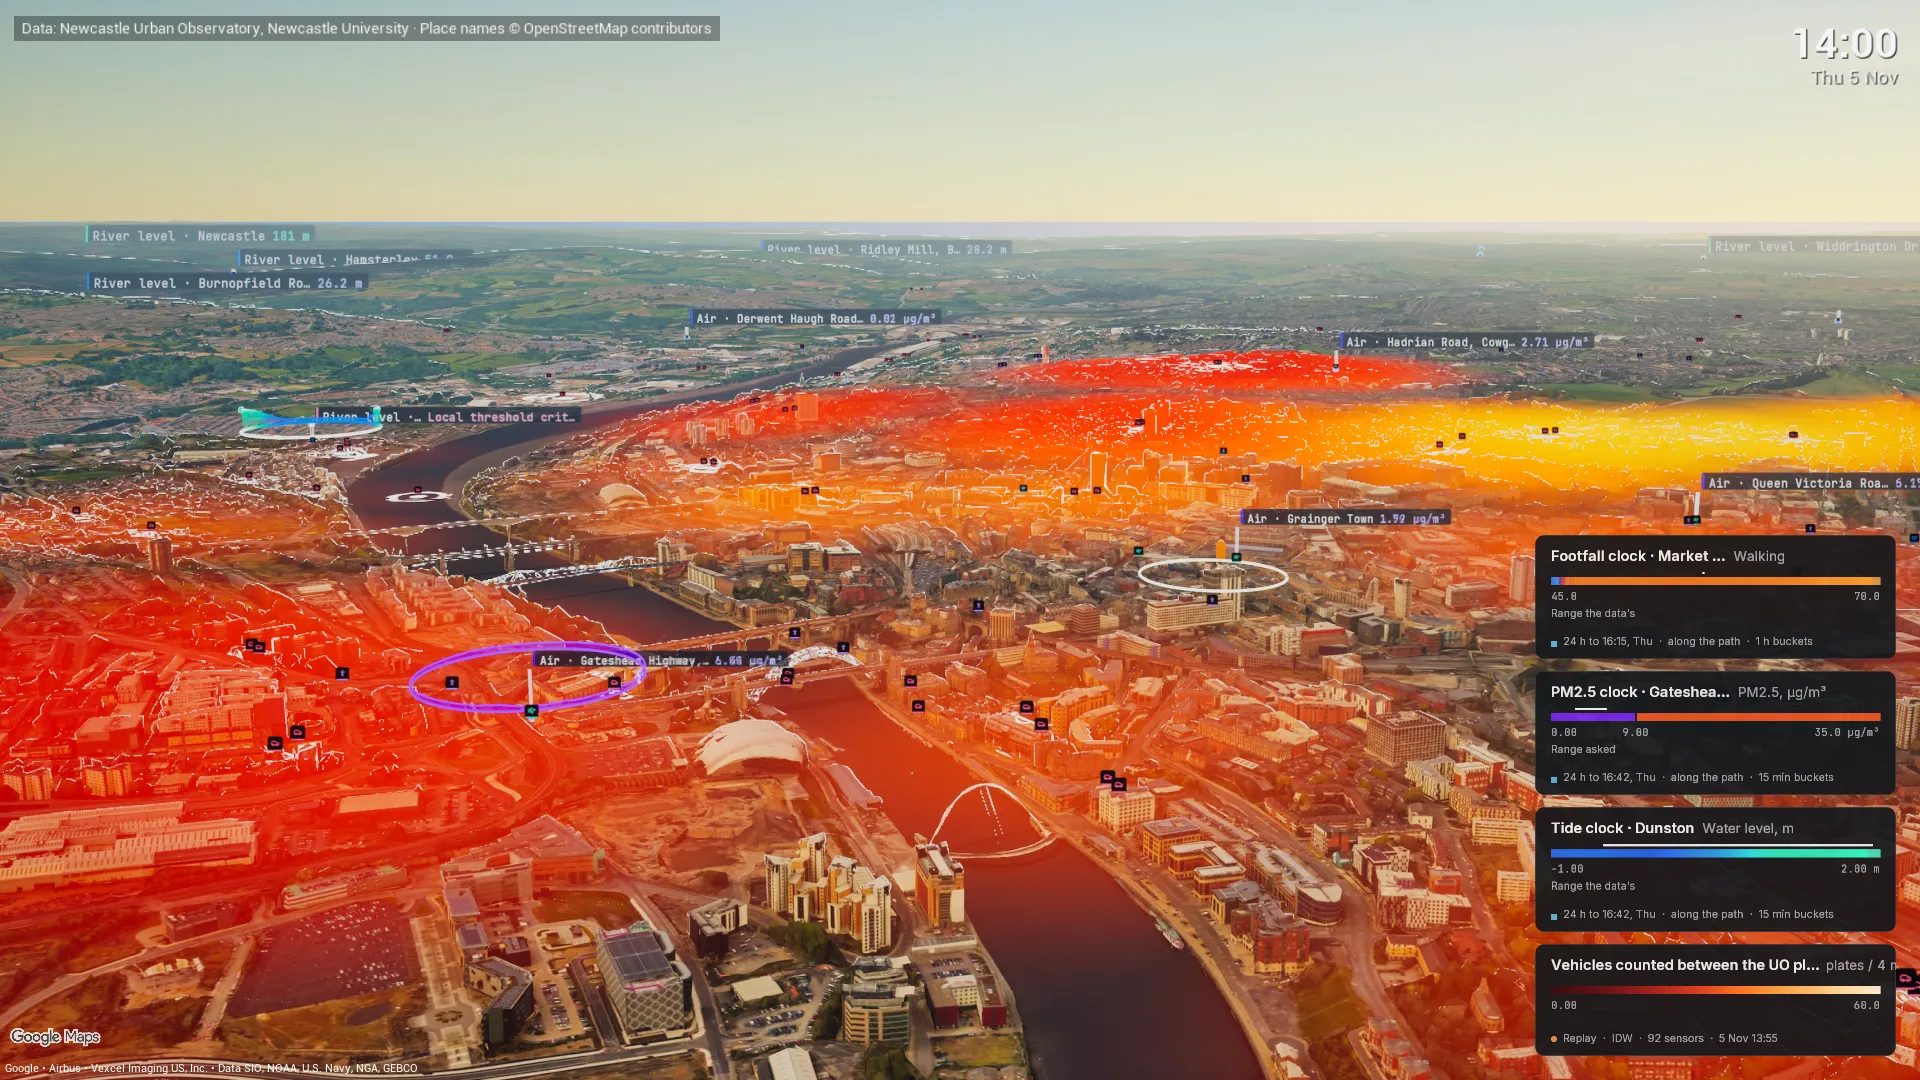
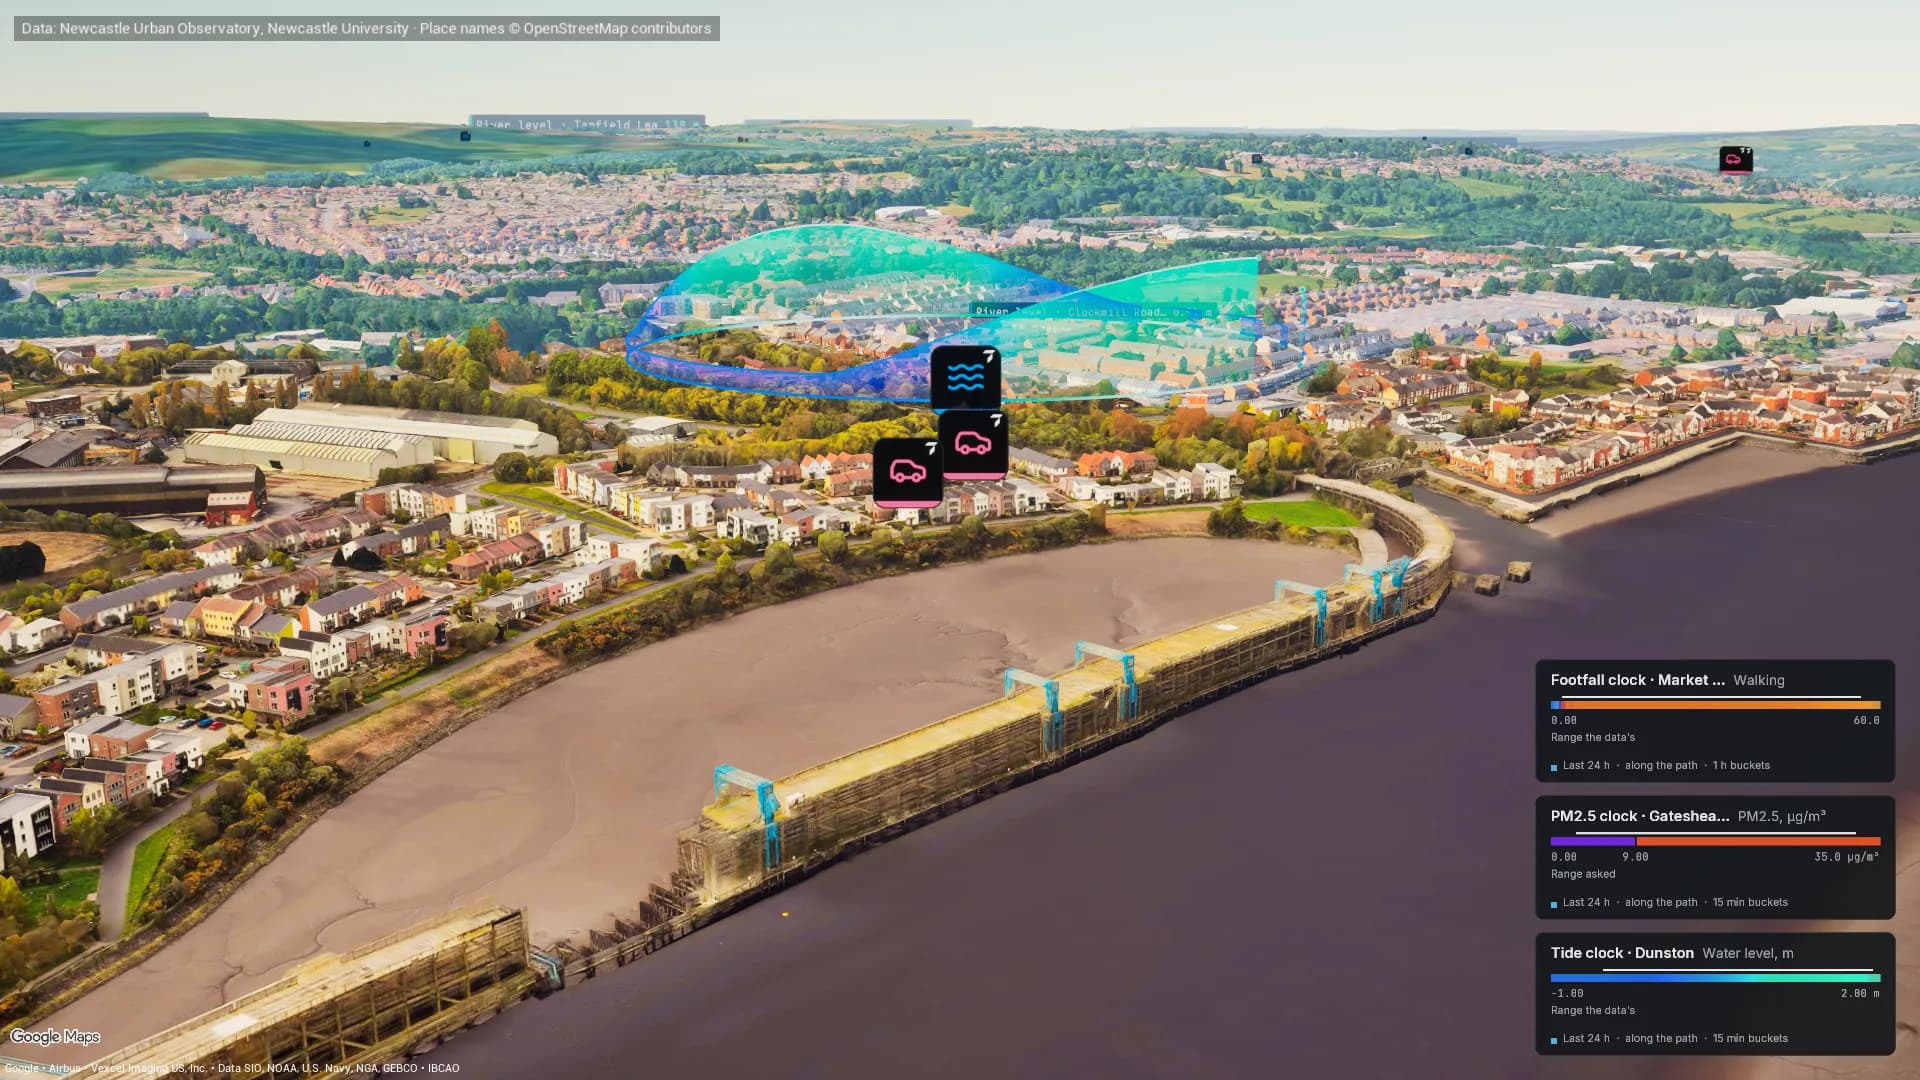
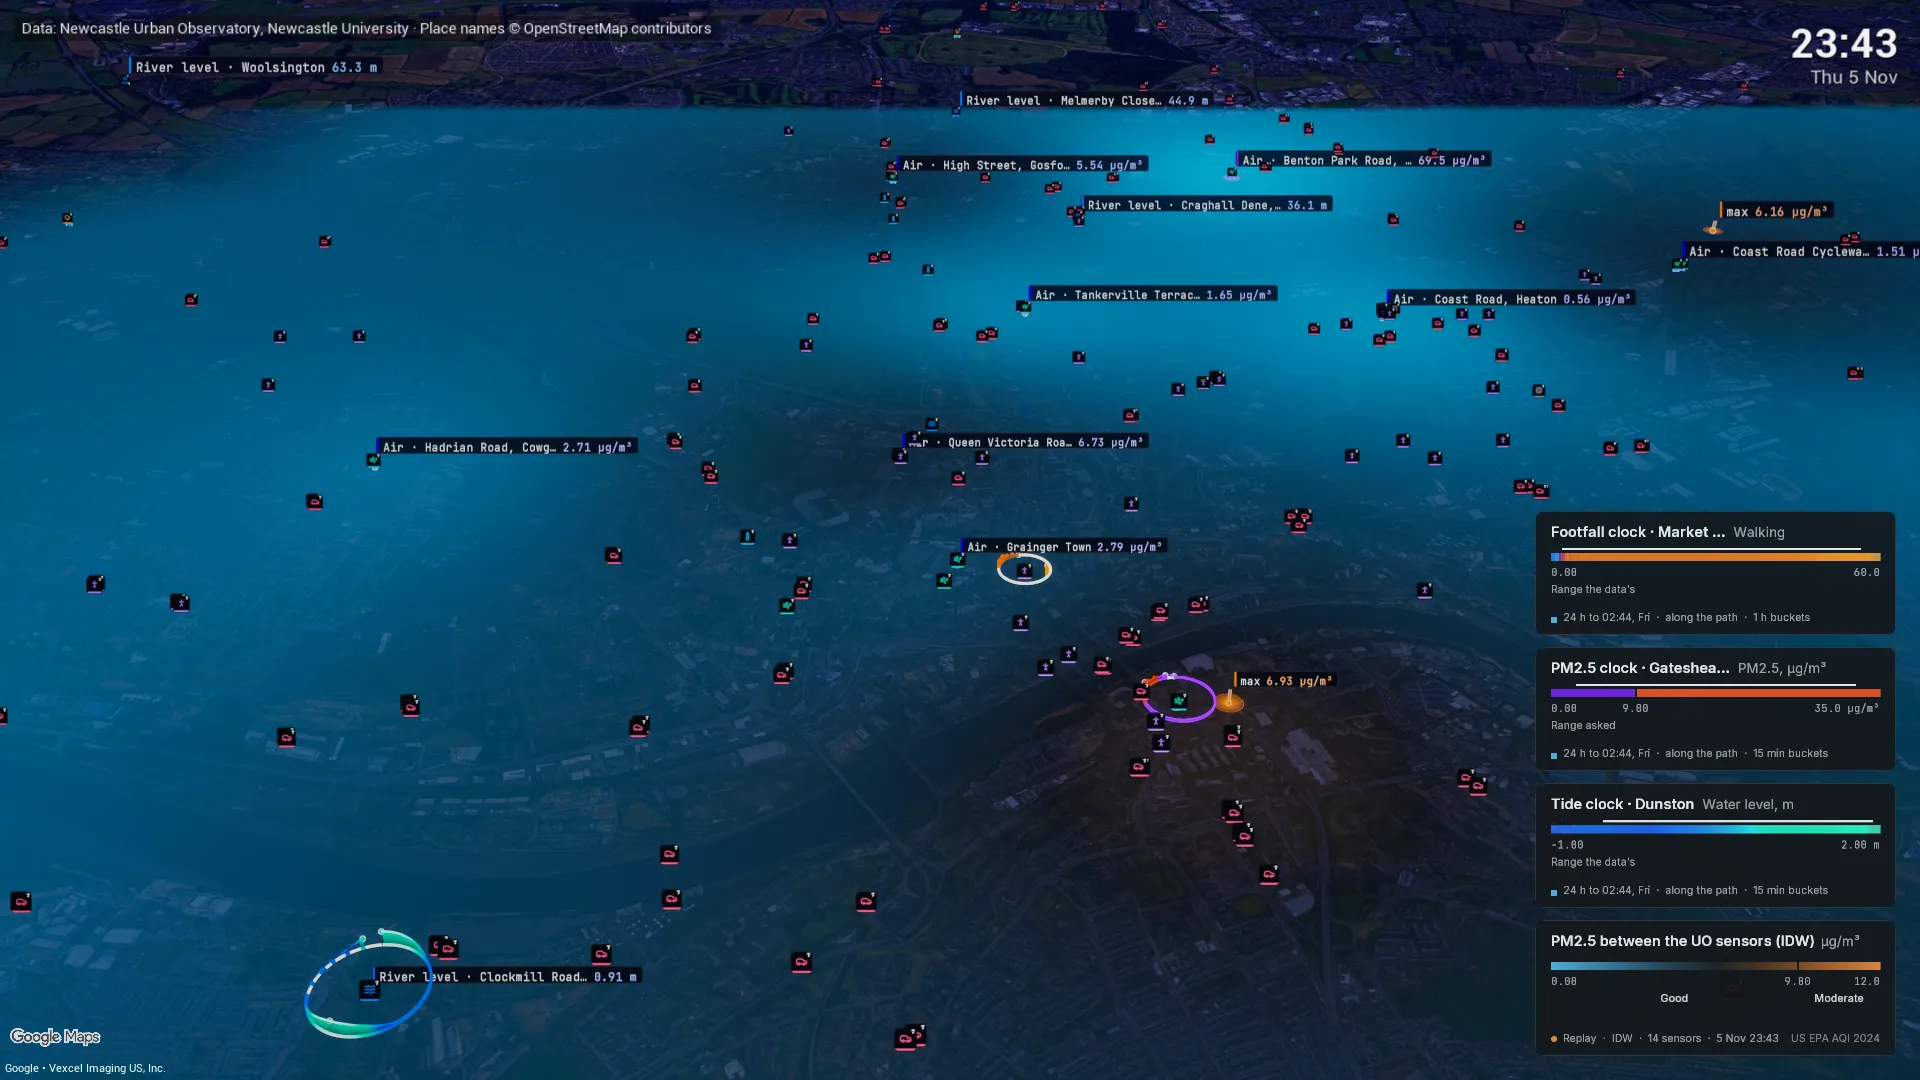
We built this on open data as a demonstration. The Urban Observatory has not endorsed it and nobody in Newcastle is a customer. The traffic layer and clock rings are Twinise visualisations drawn over the map. The same portal, alerts and Unreal plugin work with your own sensors.
Condition Monitoring
A node on the machine shows whether it is running and when it took a knock, with alerts on the limits you set and the readings on the asset in your Unreal twin.
Construction Progress
Compare each survey of a site with the one before, and see what was cut and what was filled, zone by zone, with the uncertainty on every figure.
Environment & Occupancy
Find out which rooms hold their temperature and which are really used, with each reading on its own room and an alert when a space drifts out of range.
Facility Intelligence
Your building in one model, each reading on the floor it came from, with dashboards the whole site shares.
Post-Occupancy Performance
Hold a handed-over building to its design intent, room by room, with alarm thresholds at the design range and the readings on a 3D model.
Production Optimisation
Run-state and fill levels from the line itself, shown on a 3D model of the floor, with alerts on the limits your process needs.